Every Splunk administrator has been handed the same assignment. The bill went up, nobody is quite sure why, and someone upstairs would like it to go down.
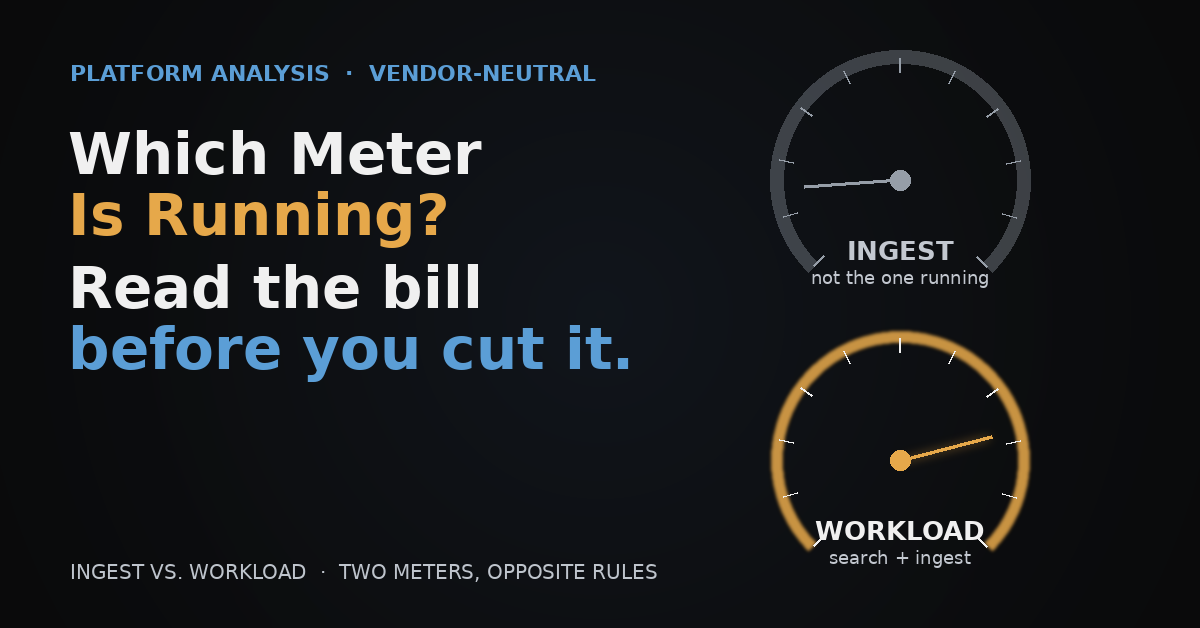
What usually follows is a round of advice — filter at the edge, tune your retention, clean up your sourcetypes. Some of it will help. Some of it will consume weeks and change nothing. Which is which depends almost entirely on a question that rarely gets asked first: which meter is actually running?
Splunk bills two different ways, and they reward opposite behavior. Until you know which one applies, every optimization you attempt is a guess.
Model One: Ingest Pricing
The traditional model. The customer buys a daily allowance measured in gigabytes per day. Index up to that allowance and everything is fine; exceed it and you get warnings, then eventually search restrictions.
The important thing about this model is what does not cost money. Searching is free. Dashboards are free. Adding users is free. Accelerating a data model is free. Splunk's own documentation is explicit that under ingest pricing you can add users and increase search and analysis activity at no additional cost. Once the data is indexed, you can hammer it as hard as you like and the bill does not move.
Which means there is exactly one lever that matters: bytes indexed per day.
That sounds simple, and it is — but it eliminates a great deal of commonly offered advice. Moving old data to cheaper storage does nothing for your license, because the license was consumed at index time and no amount of retention tuning gives it back. Cleaning up over-extracted fields improves search performance and reduces index storage, but barely moves raw indexed volume. Both are worth doing. Neither reduces this bill.
The levers that do:
Filtering at the ingest pipeline. In Splunk this is props.conf and transforms.conf routing matched events to nullQueue, where they are discarded before indexing and never touch the license. A related mechanism, SEDCMD, rewrites events in place rather than discarding them — useful for stripping a verbose block out of every event while keeping the event itself. Splunk Cloud exposes the same capability as Ingest Actions with a UI instead of config files.
Source-level reduction. Upstream of Splunk entirely. Adjust Windows audit policy so noisy event IDs are never generated. Turn off permit-logging on firewalls and keep denies. Enable flow aggregation so a thousand identical records become one summary. Move applications from DEBUG to INFO in production. Sample cloud flow logs rather than taking every record.
Event-level trimming. Keep every event, shrink each one. Windows XML events carry a rendered message block that restates the same structured fields in prose. Syslog headers repeat constant metadata. Cloud JSON carries nulls and unused nested objects. Strip that and every event survives with every detection intact — which, as we will come to, matters more than it first appears.
Architectural avoidance. Route low-value data somewhere other than a Splunk index and query it in place. Federated search options make this viable for data that must remain available but rarely justifies its indexing cost.
One useful footnote, because it catches people out: summary indexing does not consume license. Splunk's documentation is clear that summary volume is not counted, even across multiple summary indexes. But the exemption attaches to the sourcetype, not the concept — summarized events carry a default sourcetype of stash, and if you use collect to write them under any other sourcetype, you will be charged for them. The exemption is easy to lose by accident.
The Lever Nobody Can Pull
Look at that list again and one item is obviously the best. Source-level reduction costs nothing, requires no product, and removes waste at the origin rather than paying to transport it. If an application is emitting debug logs into a production SIEM, the correct fix is to stop the application emitting debug logs.
It is also the lever that almost never gets pulled, and the reasons are worth stating plainly because they explain most of this market.
You do not own the sources. The Splunk team owns Splunk. The Windows team owns audit policy. The network team owns the firewalls. Application teams own their own logging. Reducing verbosity on a production application means persuading its owner to change production configuration in order to reduce a budget line that is not theirs, accepting real troubleshooting risk for no benefit they will ever see. Multiply across every team in the organization. That is not an engineering project, it is a political one, and it proceeds at the speed of change control.
Much of it is not legally yours to reduce. In regulated environments, audit logging is mandated. You cannot reduce it because it is expensive.
The control is coarse. Logging levels are blunt. Dropping an application to INFO removes the detail you will want at three in the morning during an incident. Audit policy is per-category, not per-field. A pipeline rule can say "discard these specific events, keep everything else." A source usually cannot.
And the security team will block it. Anything you stop generating is invisible permanently, with no possibility of recovery. That objection is correct and it should win.
So the cheapest lever is simultaneously the least executable. That gap is not an incidental observation — it is the entire reason the telemetry pipeline product category exists.
A pipeline sits downstream of every source, which means the platform team controls it unilaterally. You can filter, trim, reshape and route without asking anyone's permission, without a change advisory board, and without a negotiation with a team that gets nothing out of it. It converts a political problem into a technical one you own.
That is what is being purchased. Not filtering capability in the abstract — nullQueue has been free in Splunk for as long as most of us have been using it. What a pipeline product sells is a control point the platform team can actually act on, with preview before commitment, visibility into what was dropped, and a change process that does not require organizational consent.
This same logic tells you when a pipeline product is unnecessary. A hundred-gigabyte-a-day environment with twenty sourcetypes and one administrator does not need one. Config files are genuinely fine at that scale. What breaks at scale is not capability but safety and auditability: regex is blind and irreversible, it cannot express aggregation or sampling or schema-aware transformation, it accumulates into something nobody will touch after its author leaves, and it produces no record of what was discarded or who approved it. Those are the failure modes worth paying to avoid.
Model Two: Workload Pricing
Now the same environment on the other meter, where nearly all of the above becomes secondary.
Under workload pricing the customer buys Splunk Virtual Compute units rather than a daily volume allowance. An SVC is a unit of compute, memory and I/O — and per Splunk's own pricing documentation, SVC consumption is driven by search quantity and complexity as well as daily indexing volume.
That second clause is the whole shift. Ingest still matters. But searching now costs money too, and in a mature environment it is frequently the larger share. A scheduled search firing, a dashboard refreshing, an alert evaluating, a data model accelerating in the background, an analyst running an investigation — all of it draws from the same pool.
Splunk's own positioning is instructive and runs contrary to most people's assumption: they recommend ingest pricing when you expect to search your data extensively, and workload pricing when a large volume of data will be searched infrequently. Workload pricing is designed for the write-heavy, read-light profile — compliance retention, long-tail telemetry you want available but rarely interrogate.
Which means the optimization advice inverts. Filtering aggressively at the edge still helps, because ingest contributes to SVC consumption. But an environment running four hundred scheduled searches on five-minute crons, half of them feeding dashboards nobody has opened in a year, is burning capacity that no amount of ingest filtering will recover.
The levers here are different in kind.
Scheduled search hygiene. Environments accumulate saved searches for years. Someone builds an alert for a project that ends. A report for a compliance request that gets superseded. A dashboard panel for a team that reorganizes. Nobody deletes anything, because deleting someone else's search feels risky. Every one of them continues firing on its cron indefinitely.
The audit is straightforward: searches against the internal indexes will tell you every scheduled search, its frequency, its runtime and its scan volume. Cross-reference against dashboards actually viewed and alerts that actually fired, and the dead ones surface quickly. Then delete what is dead, widen the cron on what survives — five minutes to thirty is an immediate six-fold reduction, and most alerts do not need five-minute latency — and stagger what remains.
Real-time searches deserve separate mention. They pin resources continuously rather than running and completing, which makes them the most expensive thing a user can leave running. Converting them to a frequent scheduled search is almost always the right trade.
Acceleration discipline. Two mechanisms that get conflated. Report acceleration lives in savedsearches.conf and summarizes a specific report's results. Data model acceleration lives in datamodels.conf and builds tsidx summaries across an entire model — this is what Enterprise Security runs on. Both consume compute continuously in the background whether or not anything queries them.
The waste pattern is predictable: a model gets accelerated for a use case, the use case ends, the acceleration rebuilds forever. The Monitoring Console will show you which models are accelerated, their summary size and rebuild duration; the audit log will show you whether anything actually queries them. A large summary with no queries against it is pure loss.
The highest-value knob is usually the summary range. A model accelerated over a year, queried only across the last week, is rebuilding eleven months of summary for nothing.
But acceleration also cuts the other way, and this is where administrators leave the most money on the table. A tstats query against an accelerated model can be dramatically cheaper than the raw search doing equivalent work. So the discipline is not "less acceleration" — it is killing the accelerations nobody uses and building the ones your expensive recurring searches actually need.
Search efficiency. Unbounded time ranges, leading wildcards that defeat the index, filtering late rather than early, raw searches doing work an accelerated model could answer. This is a training and review problem rather than a configuration change, which makes it slow, but it compounds across every scheduled search in the environment.
Concurrency management. SVC capacity is sized against peak concurrency, not average. If two hundred searches fire simultaneously at the top of every hour because everyone accepted the default cron, you are provisioning for a peak that lasts ninety seconds. Distributing those schedules across the hour reduces required capacity without removing a single search.
A Note on Regulated Environments
There is a category of environment where source-level reduction is off the table, and it is worth naming because the advice given to these organizations is frequently wrong.
Where retention is mandated, you cannot reduce the mandated sources themselves, audit logs, security event logs, whatever the regulation names. That is not a negotiation. But mandated is not the same as all. Debug output from an internal application, verbose logging nobody is required to keep — ordinary filtering still applies to anything the regulation doesn't name.
What remains for the sources you can't touch is event-level trimming: keep every mandated event, strip the portion of each one that carries no evidentiary value. You can't collect less. You can collect smaller. Combine that with everything under Model Two — search-compute cost is untouched by retention mandates and is frequently the larger share of spend in exactly these environments — and the regulated customer has real levers, just not the ones usually offered. This is not a niche. It is a large share of the organizations running the biggest Splunk deployments, and it is the segment where cost-reduction advice most often arrives in a form they cannot legally use.
What to Do With This
Before the next cost conversation, answer two questions.
Which pricing model is this environment on? If nobody internally knows — and frequently nobody does — the account team can answer it in five minutes. Everything downstream depends on it.
And what is the scheduled search load? Not because the answer is always the problem, but because it is the number that almost nobody has, and its absence is diagnostic in itself. An organization that cannot tell you how much of its capacity goes to searching nobody reads has not been shown where its money goes.
Those two answers determine which half of this article is relevant. Without them, any optimization program is being run on assumption — and the most common failure in Splunk cost work is not bad technique. It is excellent technique applied to the meter that was not running.